Usage
The Usage page (/usage) shows how much you've used Lumen — your requests, tokens, coins, and
activity patterns over time. It's available to every logged-in user from the main navigation.
Time Period
A Period selector at the top right controls the window for every stat and chart on the page:
| Period | Window |
|---|---|
| Week | The last 7 days (default) |
| Month | The last 30 days |
| Year | The last 12 months |
| All Time | Everything on record |
Each window starts at the top of the hour, so "the last 7 days" runs from the beginning of the hour that was 7 days ago rather than from this exact minute. Numbers can therefore include up to an extra 59 minutes of activity at the far end of the window.
Summary Cards
| Card | Description |
|---|---|
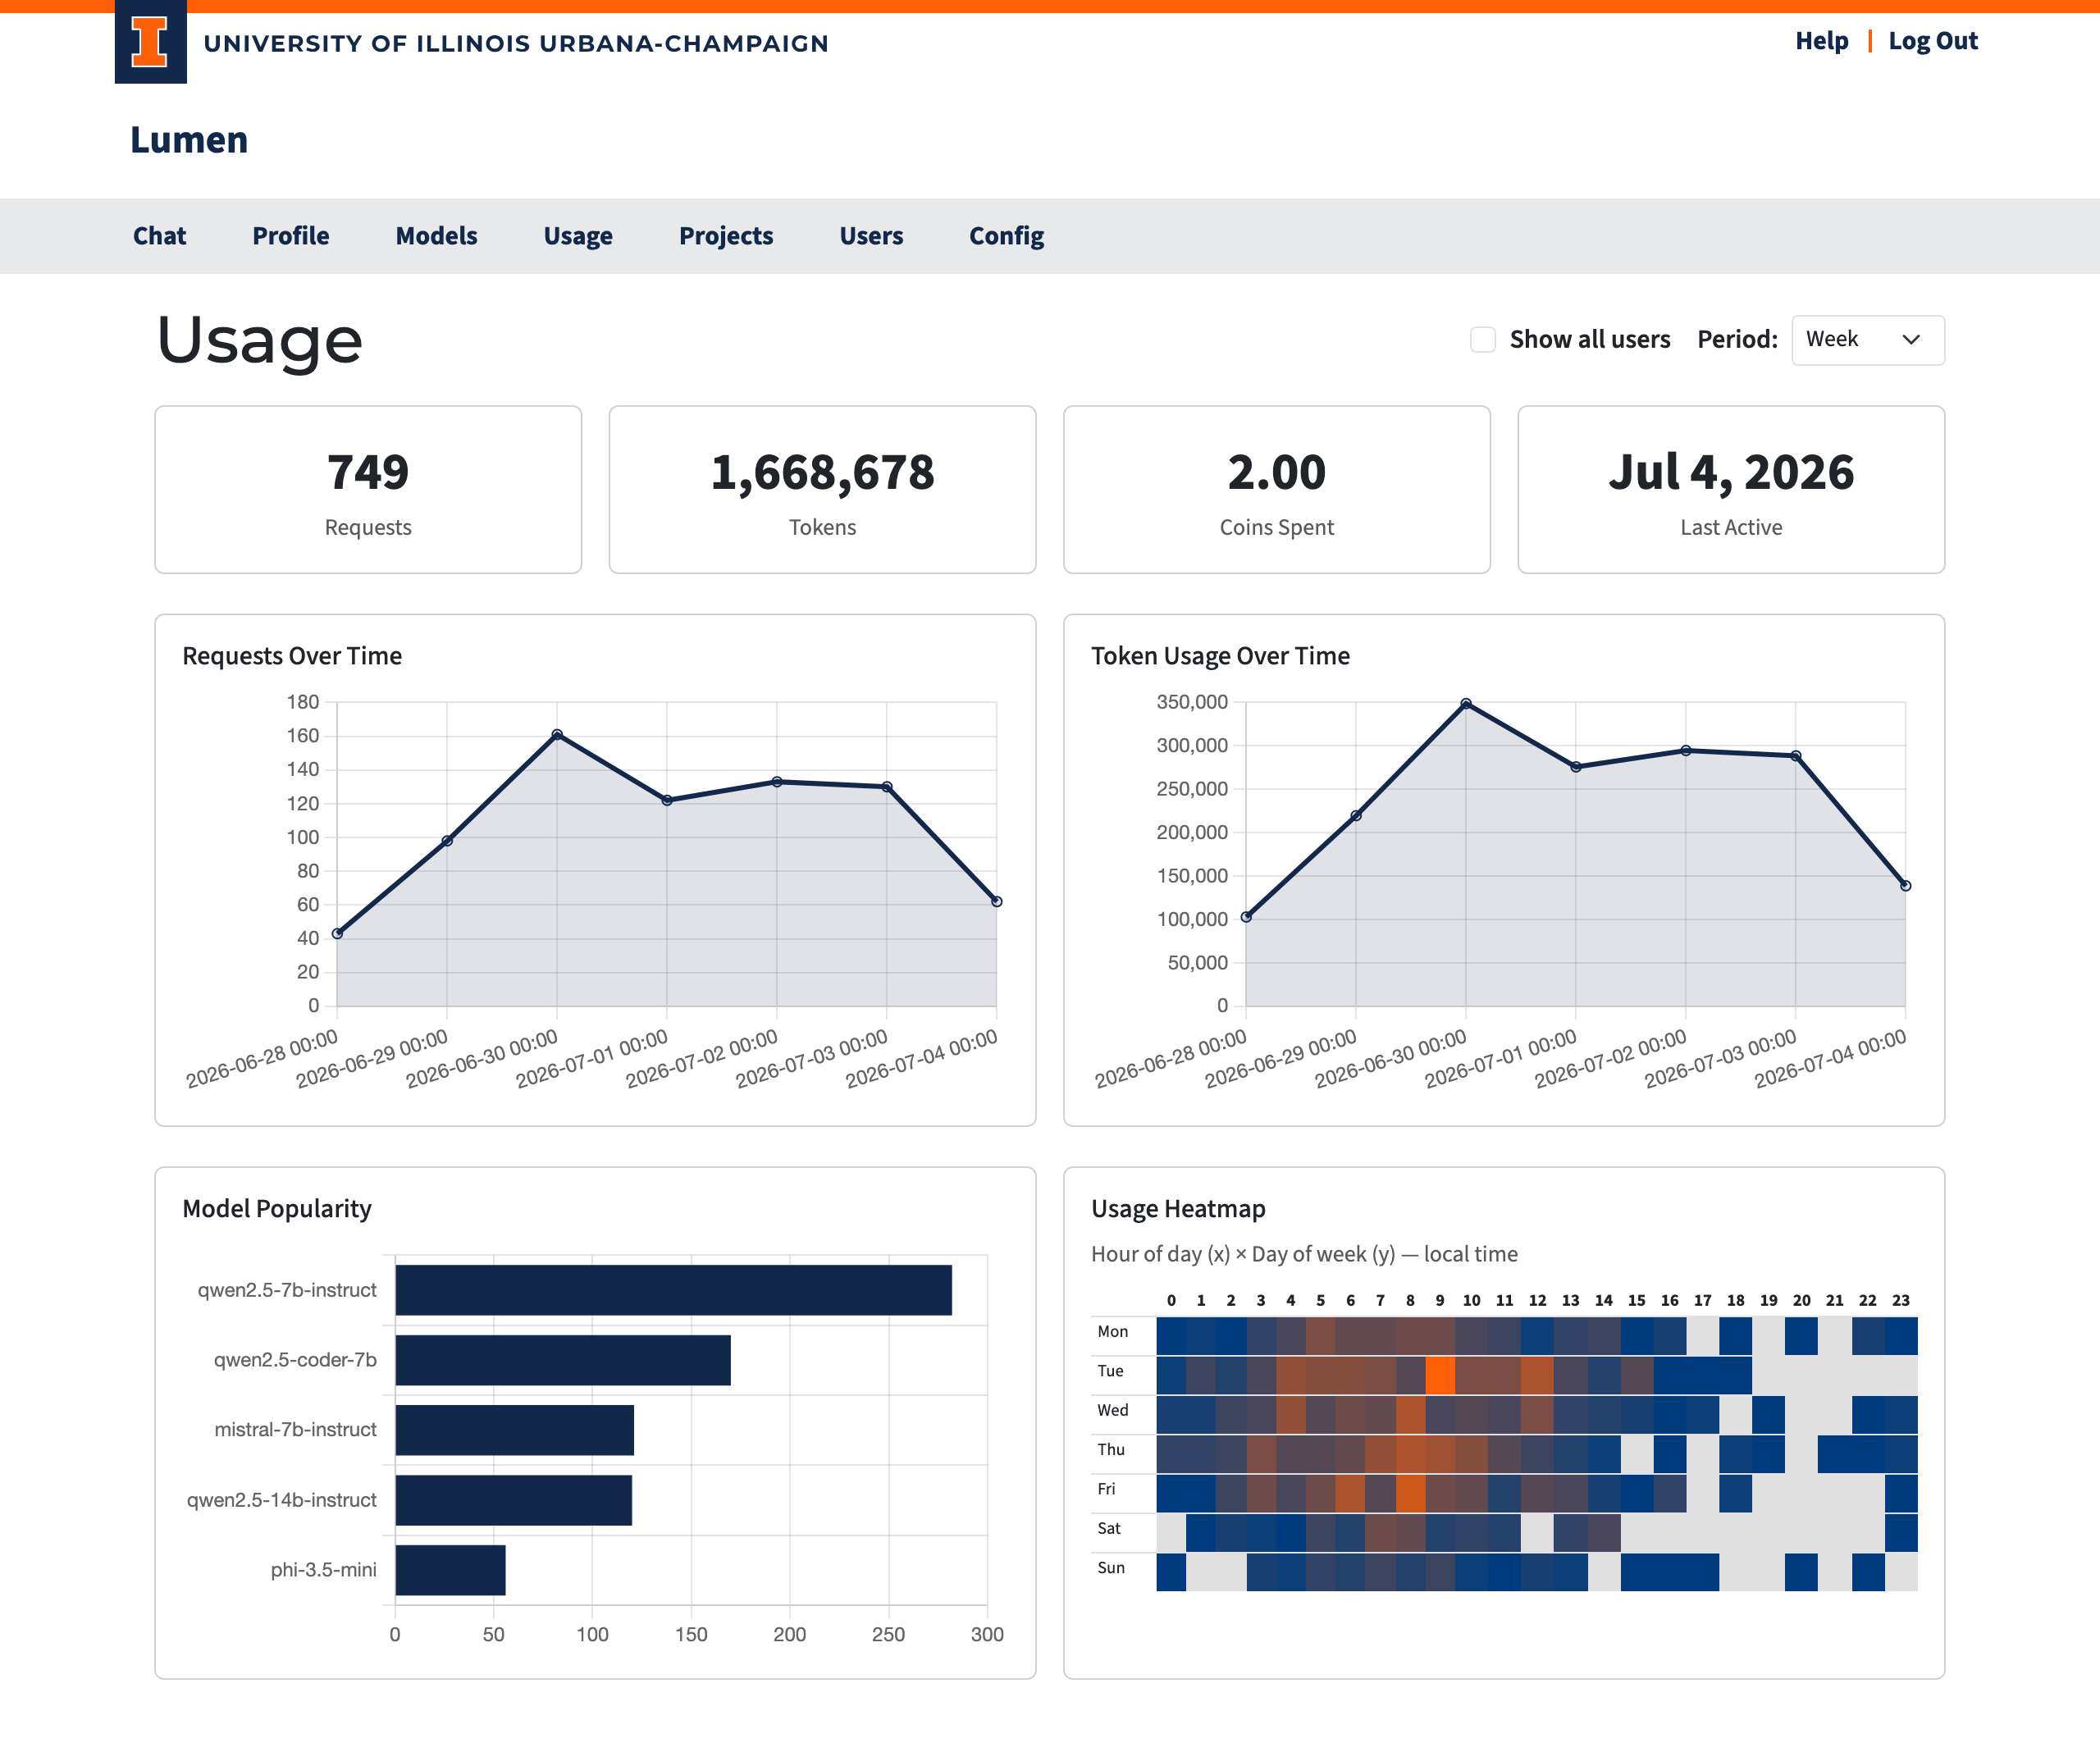
| Requests | Number of requests in the selected period |
| Tokens | Total input + output tokens in the selected period |
| Coins Spent | Coins consumed in the selected period |
| New Users | New user accounts created in the period (admin "Show all users" view only) |
| Last Active | When the selected user most recently sent a request (shown only when filtered to one user) |
Charts
- Requests Over Time — request volume across the selected period.
- Token Usage Over Time — input + output tokens across the period.
- Model Popularity — a bar chart ranking the models you've used most.
- Usage Heatmap — requests laid out by hour of day (columns) against day of week (rows), in your local time, so you can see when activity peaks. Hover over, tap or focus a cell to see its request count (arrow keys move between cells); on small screens the grid scrolls sideways.
- New Users Over Time and Total Users (Cumulative) — user-growth charts that appear only in the admin all-users view.
Admin View
Admins see their own usage by default, with two extra controls:
- Show all users — a checkbox that switches the page to system-wide totals across every user and project, and reveals the user-growth charts.
- Per-user filter — from the Users admin page, the bar-chart button next to a user opens the Usage page filtered to that user. A banner at the top shows whose usage you're viewing, with a Clear filter link to return to your own.
Requires PostgreSQL. The usage analytics are powered by aggregate tables that only exist on PostgreSQL. On a SQLite (development) database the page loads but the stats and charts are empty.